Bitcoin & Ethereum Macro Cycle Intelligence
Stop reacting to Bitcoin. Start reading the cycle.
One dashboard for on-chain, macro liquidity, ETF flows, and historical cycle models, so you know when to accumulate, when to wait, and when to reduce risk.
Free dashboard, no signup. Built for investors thinking in cycles. If you want entry signals for tomorrow, this isn't it.
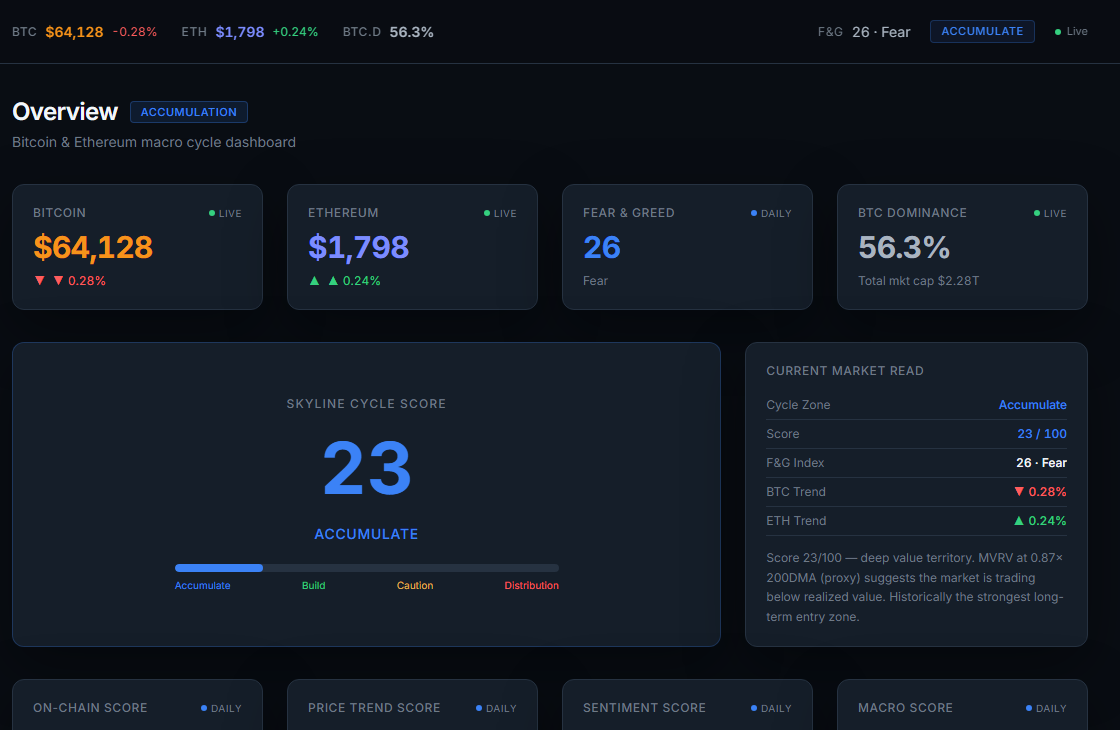 Cycle ScoreLive Market DataMacro Score
11
Indicators behind every Cycle Score
2012
Price history the models run on
50+
Models and dashboards
4
Halving cycles covered
Every figure above is checkable inside the terminal. No rounded-up user counts.
Designed for investors who think in years, not days.
Whether you're stacking Bitcoin every paycheck or managing a seven-figure portfolio, Skyline helps you separate short-term noise from long-term opportunity.
No hype. No price calls. Just cycle data.
Every chart answers one question.
Are we in accumulation or distribution?
Is liquidity supporting higher prices?
Are institutions actually buying?
Are long-term holders accumulating or distributing?
How much risk is left in this cycle?
The charts give you the data. This tells you what it adds up to.
Every model on the terminal is read into a single research report, the kind an institutional desk publishes. It states a position, shows the evidence on both sides, and tells you what would prove it wrong.
What's in every report
Rebuilt from live data each time you open it. Print or save as PDF.
Probabilities, never predictions.
Deep Research reports where the evidence sits and how confident that reading is. It does not forecast price, and it does not tell you what to buy. Data first, opinion second.
Everything on one terminal
50+ Bitcoin & Ethereum models in one place.
Skyline Cycle Score
One number that tells you where Bitcoin sits in the four-year cycle.
View liveBTC vs GLI Liquidity Lag
See how global liquidity leads Bitcoin by weeks or months.
View liveLiquidity Regime Matrix
Instantly know whether macro conditions are a tailwind or headwind.
View liveETF Flows & Dominance
Track daily institutional ETF demand, inflows/outflows, and dominance shifts.
View liveFull On-Chain Suite
Every major on-chain signal: SOPR, NUPL, HODL waves, realized price, and more.
View liveHalving & Seasonality Models
Compare every Bitcoin halving cycle since 2012, plus monthly and yearly patterns.
View liveWhy investors use Skyline
The Cycle Score is a weighted read of 11 independent indicators: Pi Cycle, MVRV, Puell Multiple, 2-year MA, power law, NVT, Fear & Greed, active addresses, stablecoin supply, hash ribbons, and Reserve Risk
Every indicator is percentile-ranked against Bitcoin's full price history back to 2012, so a reading is scored against its own distribution rather than a threshold someone picked
Covers all four halving cycles: 2012, 2016, 2020, and 2024
Indicators that can't be computed are shown as gaps, not quietly dropped from the average
50+ models and dashboards, from ETF flows and global liquidity to HODL waves and altseason
Here is where the score was wrong.
Across the last three Bitcoin cycles, the Cycle Score read Accumulate at all three cycle bottoms and Distribution Risk at the 2017 top. At the 2021 top it reached only 68: Caution, not Distribution Risk. That is a miss, and it is published alongside the hits, computed point-in-time so no reading uses data from after its own date.
See the full track recordGet the weekly cycle read
One email each Sunday: the current Cycle Score, what changed, and one thing worth understanding. No hype, no price calls.
Free. Unsubscribe any time. Educational only, not financial advice.
Free vs. Premium
Try the core product free. Upgrade for the full terminal.
Free
Perfect for checking Bitcoin's current cycle position.
- Skyline Cycle Score
- BTC price overview
- Fear & Greed
- 4-Year Cycle
- Overview dashboard
Premium: $99/yr
Everything you need to make long-term allocation decisions.
- Skyline Deep Research report
- Every chart and model
- Full on-chain suite
- Macro liquidity dashboards
- ETF flows and dominance
- Shareable chart cards
- New models added over time
Simple, yearly access
One plan. Every chart. Cancel anytime.
Less than $9/month.
Billed once a year. Cancel anytime.
- Skyline Deep Research report
- Every chart and model
- Full on-chain suite
- Macro liquidity dashboards
- ETF flows and dominance
- Shareable chart cards
- New models added over time
- Cancel anytime
Card or Cash App via Stripe. Already have an account? Log in
Frequently asked questions
What is Skyline Cycle Terminal?
A Bitcoin & Ethereum macro intelligence platform that combines on-chain data, liquidity, ETF flows, market structure, and cycle models into one dashboard.
Who is Skyline for?
Long-term Bitcoin investors, macro traders, and anyone trying to understand where Bitcoin sits in its four-year cycle, not day traders looking for entry signals.
Is this financial advice?
No. Skyline provides market analytics and historical cycle models to inform your own research, not financial, investment, or trading advice.
Do I need an account to use the free dashboard?
No. The free Cycle Score, BTC price, Fear & Greed, and Overview dashboard are available without signup.
How often is data updated?
Cycle signals move in weeks and months, not seconds, so the cadence matches the data. BTC/ETH prices and dominance update throughout the day; on-chain and macro dashboards refresh daily, as their source data does. Nothing here is built for tick-by-tick trading.
What does premium include?
Premium unlocks the full terminal, including on-chain models, macro liquidity dashboards, ETF flows, share cards, and new charts as they ship.
Can I cancel?
Yes. Cancel anytime before your renewal date and you won't be charged again.
Stop guessing where Bitcoin is.
Know where the cycle stands before making your next move.
Start Free